The core of any digital marketing campaign is a constant flow of trusted and authoritative website content.
But sometimes businesses and SEOs don’t fully qualify the value of content – never mind the need for consistent new content weekly, such as a blog or educational articles on the products or services.
Why the downplay? Because there’s no universal method to measure its return on investment, and most value metrics are qualitative rather than quantitative.
Does this leave the analytics of on-site content marketing to the realm of fancy? The answer is no.
Fortunately, we can measure the quantitative metrics of content engagement and lead generation using Google Analytics.
Before getting into the basics of using Google Analytics for measuring your content efforts – whether your blog, service/product pages, or FAQs – let’s provide a few points why quality on-site content will never be dethroned.
- Quality content nurtures leads, transitioning visitors to prospects and prospects to qualified leads.
- Quality content can quickly build a brand’s authority, which will lead to more readers and higher rankings.
For content marketers, Google Analytics helps validate your content creation efforts, allowing you to set baselines and measure the performance of each piece of content and its role in your inbound marketing efforts and sales funnels.
Following are five actionable tips for leveraging Google Analytics to refine your content marketing campaign.
1. Google Analytics: Traffic
The Google Analytics traffic report shows overall site traffic, as well as traffic sources. This metric should serve as the starting point to assess your overall keyword research and content marketing campaign. Organic traffic to blog posts will be a direct result of that webpage’s authority and keyword rank.
More importantly, website owners can analyze their total traffic from referral traffic sources. These sources are typically a result of guest posting on other blogs or publications highly relevant to yours.
Users who land on your site from referral sources are more likely to bookmark to your blog, sign up for your newsletter, or engage with other content on your website.
Referrals may generate from other sources, such as social media sites and search engine result pages (SERP).
2. Google Analytics: Audience Demographics
Keyword research still serves a fundamental role in interpreting user intent for content marketers. Beyond this research, businesses should also conduct thorough audience analysis to understand the needs of their audience based on three select boundaries:
- Demographics
- Habits
- Psychographics
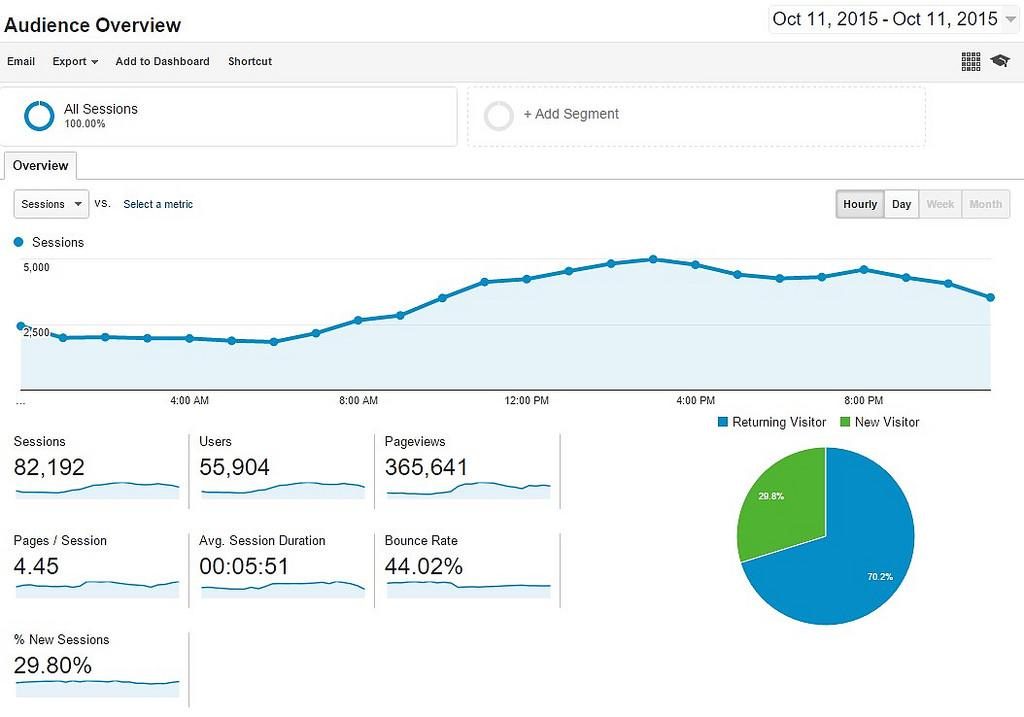
Google Analytics provides an audience demographics tab to view the demographics of people who visit your website. This research can be further segmented by age, gender, geographic location, and numerous other factors.
Research the online consumption habits and social media channels of choice for users who visit your website based on this demographic research. Provide supplementary content to pique reader interest of users who land on your site, and spend time creating appealing headlines to cultivate leads when sharing your content on other channels, such as Facebook or LinkedIn.
Remember these two points when analyzing audience demographics:
- Audience analytics serves as a powerful tool to develop topics that cater to user interest- this results in increased user engagement.
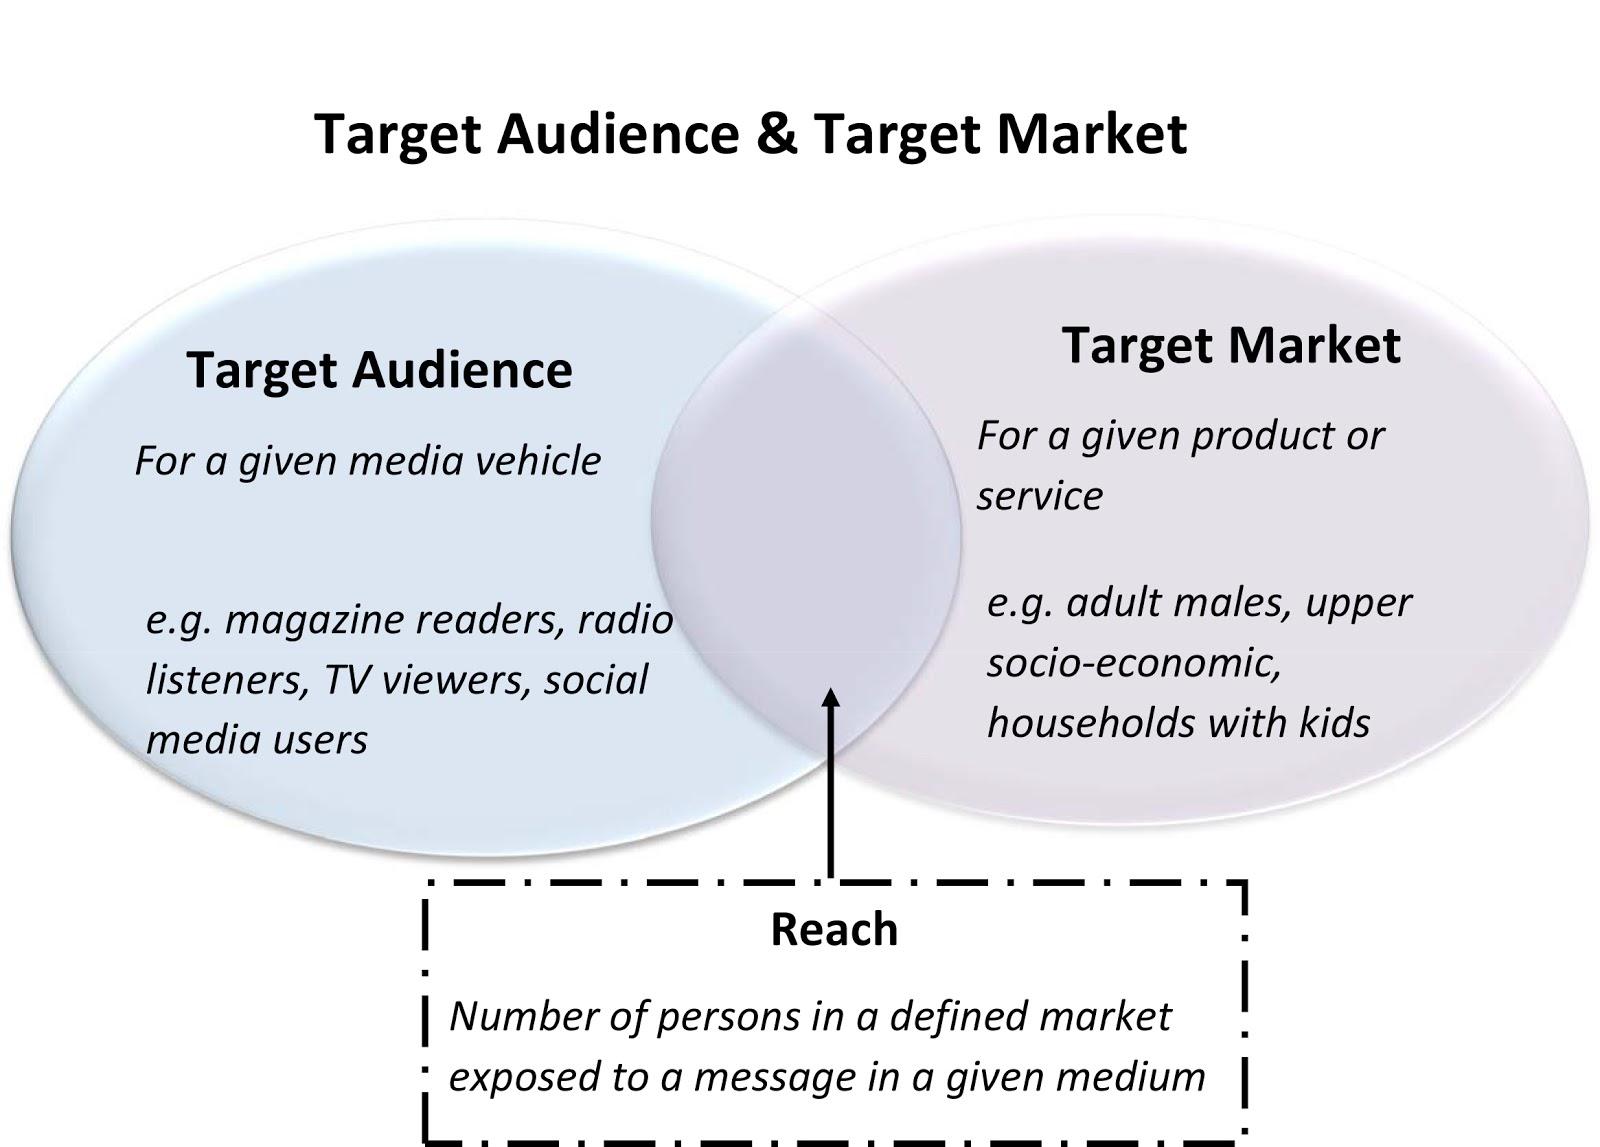
- Analyze how the demographic research and referral traffic sources match up against your business objectives and your target audience research.
3. Google Analytics Basics: All Pages
Once a basic audience analysis of site visitors is established, use Google Analytics to determine the value of your content based on its lead metrics, such as page views and sessions.
The “All Pages” tab will be located under the “Site Content” tab.
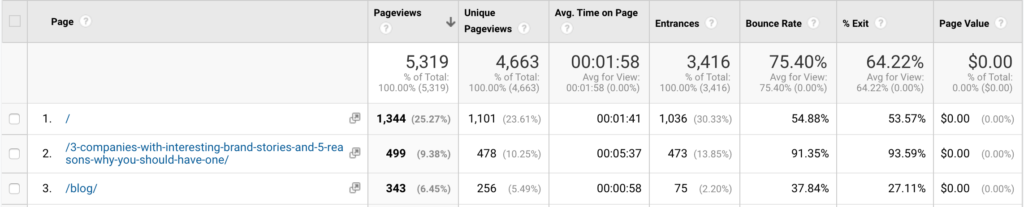
This will provide a basic overview of your most popular webpages in terms of total page views, sessions, and conversion rates.
The “All Pages” tab also provides other crucial quantitative page metrics:
- Dwell Time- the average time a user spends on a webpage
- Entrances- number of times a page was the first viewed in a session
- Bounce Rate- number of entrances which “bounced” and made no further site interaction
Bounce rates are a tricky metric because a visitor who landed on-page and submits a signup form will display a low bounce rate. On the other hand, someone who reads through multiple blog posts may register a high bounce rate. Interpreting this data depends on your conversion goal.
- Improve your bounce rate by A/B testing headlines on frequently visited web pages.
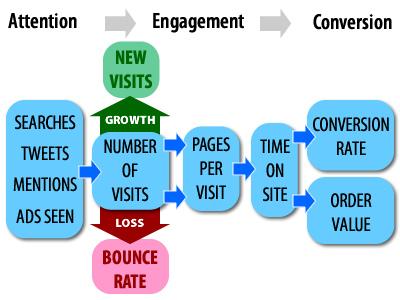
Page sessions are vital because they serve to display how engaging each piece of content is, as well as its function in your sales funnel. Essentially, a website session is the total number of interactions (page views, transactions, etc.) that take place each time a visitor lands on your website.
These metrics provide a quantitative measurement of your content’s efficacy to drive engagement, and nurture leads toward conversions.
The “Content Drilldown” tab allows webmasters to analyze the performance of subfolders and segment your content into categories or themes.
Finally, the “Landing Pages” tab gives a comprehensive overview of which pages users arrive at your site.
4. Google Analytics Basics: Acquisitions
Google Analytics’ “Acquisition” tab provides tracking features that analyze what traffic sources are driving the most conversions. These channels include traffic from referral sources, the keywords used in Google AdWords campaigns that helped people find your site with, and the performance of active campaigns.
Webmasters can insert a line of code into their HTML, “AddThis”, to add social share widgets that Google Analytics actively tracks.
After adding this, go into your “Social” tab under “Acquisitions.” You will be able to track the number of shares each piece of onsite content gathers, as well as the amount of traffic received from social networks.
While social signals may not serve as a direct ranking factor- as far as we know- they’re generally an excellent quantitative metric to track your content’s value.
5. Google Analytics Basics: Goals, Funnels, Values
Content marketers should not solely focus on the number of reads or shares gathered from the content. The fundamental question here remains: Is my content converting?
Webmasters can set up custom goals or track goals from Google Analytic’s “Template.” There are three types of goals that are important to any conversion funnel:
- Destination goals are accomplished when someone lands on the desired webpage
- Event-based goals track specific user actions, such as downloads or purchases
- Engagement goals follow user signals such as dwell time and pages per visit
While it’s tricky, webmasters can assign values to specific goals to track the commerce value of each visitor who lands on your site. Track how individual webpages serve your conversion funnel through funnel tracking.
This will give you insight into which pages receive the most bounces, as well as which pages contribute the most toward a destination or event-based goal.
Getting Started with Google Analytics: Concluding Thoughts
Tracking the success of your content is essential toward maintaining – and growing – your bottom line. Creating content is not about publishing but delivering desired actions. Leverage Google Analytics to see how much traffic your content is driving, as well as its importance in your conversion funnel.
Content marketing is a dynamic process that requires refinement and constant repurposing, along with the obvious of a constant flow of new content. Leverage data to find areas where your content can serve your audience and supplement other digital marketing campaigns.